The Power of Diversification
Submitted by Kaizen Financial Advisors, LLC on January 30th, 2017Why do we advocate for diversifying your investment holdings? The answer goes beyond the simple adage of “don’t put all your eggs in one basket”.
To understand the power of diversification, first, you need to understand how investment returns are measured. There are two primary methods of measuring average investment returns. The first, and most simple method, is called an “arithmetic” average. This is where one simply averages annual returns to arrive at the average return. Consider the following three years of annual returns: 10%, 5%, and 15%. The arithmetic average is a simple average each years’ return, which equals 10% [(10% + 5% + 15%)/3].
The alternative method of calculating the average return is called “geometric”. Geometric averages encompass the impact of compounding. Let’s take a look at two examples…
Example 1: Say we start with $1,000 and grow it by a compounded 10% each year for 3 years…the result is an investment worth $1,331.
Yr 1: $1,000 grows at 10 % = $1,100
Yr 2: $1,100 grows at 10% = $1,210
Yr 3: $1,210 grows at 10% = $1,331
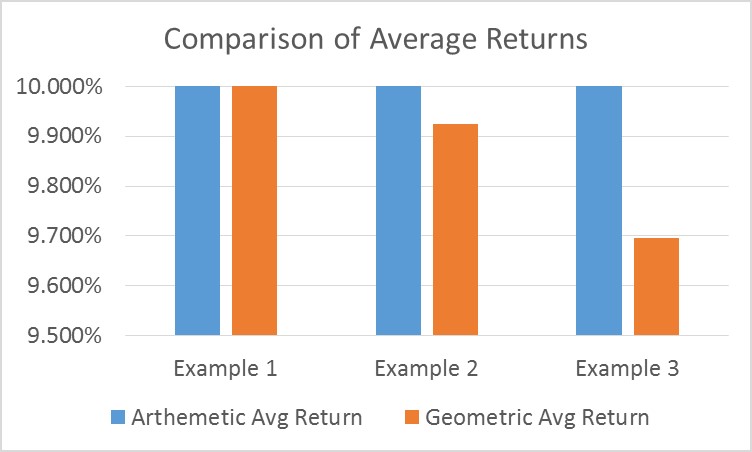
Example 2: Now let’s compound our investment using our prior returns of 10%, 5%, and 15%, which as we noted, have an arithmetic average of 10% per year. Now our investment is only worth $1,328.
Yr 1: $1,000 grows at 10 % = $1,100
Yr 2: $1,100 grows at 5% = $1,155
Yr 3: $1,155 grows at 15% = $1,328 ($3 less than Example 1)
Note how the returns in both examples grew at an arithmetic average of 10% per year, but did not produce the same investment value at the end of the three year period. The returns in the second example were more volatile and generated a lower ending value, despite the fact it had the same arithmetic average return as example 1. This would be troubling if we did not have an alternative method of calculating average returns…introducing the “geometric” average.
For those mathematical types, the calculation of the geometric average in example 2 is as follows… [((1.1 x 1.05 x 1.15)) ^ (1/3) - 1] which equals 9.924% not 10%. As we expect, the average is less than 10% which reflects the lower ending value realized in example 2. Now this makes more sense.
In fact, the more volatile the returns become, the lower the geometric average becomes. As investors, our account values actually change in relation to geometric average returns, not arithmetic average returns. Consider an even more volatile set of returns which we will call example 3.
Example 3: Suppose our three years returns were as follows 10%, 0%, and 20%, which by the way, still has an arithmetic average of 10% per year.
Yr 1: $1,000 grows at 10 % = $1,100
Yr 2: $1,100 grows at 0% = $1,100
Yr 3: $1,100 grows at 20% = $1,320 ($8 less than example 2)

So what can we take away from this venture into investment mathematics? All else held equal, portfolio volatility is detrimental to your wealth. Specifically, for portfolios with the same arithmetic average returns, you will retain more value if those returns are less volatile. So what do we do to reduce volatility? We diversify your holdings across asset classes.
Let’s look at how this works inside your portfolio. Take large cap domestic and large cap international equity. Over long periods of time, both asset classes have similar returns and volatility characteristics, but over any given year they can move quite differently and produce significantly different returns. When blended together something interesting happens, the combined volatility, is generally lower than either investment class by itself. Thus the portfolio volatility has been reduced.
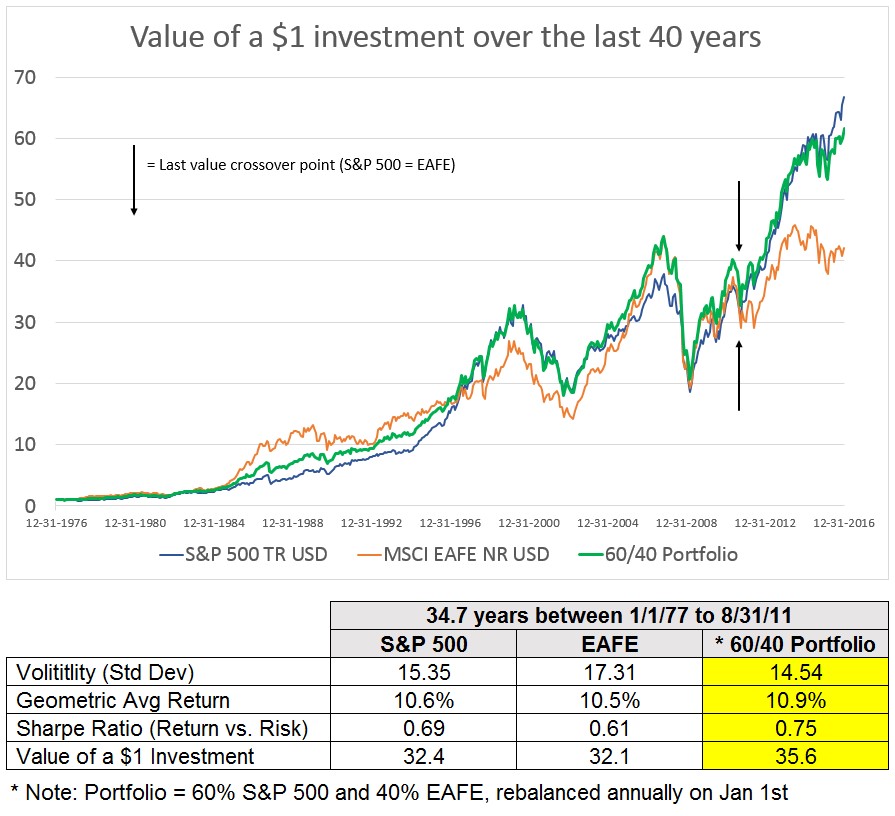
Look at the example below. Between January 1977 and May 2010 the cumulative returns of S&P 500 just surpassed EAFE, which has occurred many times over their history. With both asset classes returning approximately 10.6% with volatility of 15.4 and 17.3 respectively, one would expect a portfolio containing both asset classes to generate the same returns. However, that is not the case. The 60/40 blended portfolio generated a geometric average return of 10.9%. This was 0.3% better than either asset class by itself and did so with less volatility, 14.5. Bottom line, the investor in the 60/40 portfolio created more wealth.

So what did this exercise explain: When combined with a proper rebalancing strategy this two asset class portfolio will generally produce higher portfolio values over the long-term, relative to a portfolio that holds only one of the two asset classes. This is one of the significant values of diversification for long-term investors.
At Kaizen we apply the concepts of portfolio theory, including diversification, to improve wealth creation for our clients.
This material is subject to the copyright protection of Kaizen Financial Advisors, LLC and its agents and employees (collectively, “Kaizen”) and may not be reproduced in part or in whole without the prior written consent of Kaizen. This material is not intended for distribution to, or to be used by, any person or entity other than the person or entity to whom this was originally delivered. This material is also not intended for distribution in any jurisdiction in which distribution would be contrary to law or regulation.
Furthermore, this material is for general educational and informational purposes only. Although the information was compiled from sources believed to be reliable, Kaizen does not assume any responsibility for its accuracy or completeness. This material is not meant to replace independent professional judgment and should not be relied upon as legal, financial, tax or any other type of professional advice of any kind or nature whatsoever. Audience members should refrain from taking action based on this material without first consulting with their own attorney, tax adviser, or financial adviser.

