![]()
Q1 Quarter-End Report
Submitted by Kaizen Financial Advisors, LLC on April 8th, 2016The first quarter of 2016 is now in the books. The quarter was characterized by large swings in equity prices that ended near where they started. First quarter brought us mostly small positive returns across the major indices, which means that investors survived the worst start to a calendar year ever for the U.S. stock market.
Let's take a closer look at the specific details.
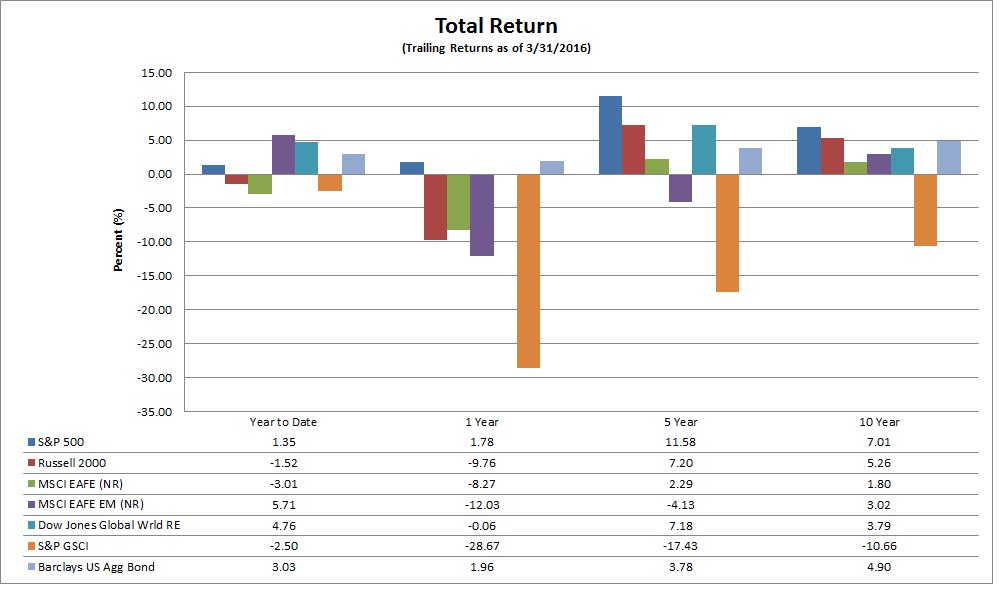
* Note that S&P 500, Russell 2000, Dow Jones Global World Real Estate, S&P GSCI, and Barclays US Aggregate Bond indices are reported in total return (TR), which includes all dividends reinvested, while MSCI EAFE and MSCI EAFE Emerging Markets are reported in price index (PR), which does not include dividends.
Q1 U.S. Index Performance
National markets, as measured by the S&P 500 and the Russell 2000 indices were mixed:
- The S&P 500 index posted a slight gain of 1.35%.
- The Russell 2000 Small-Cap index was down 1.52%.
Q1 Global Returns
The global markets were also mixed for the quarter:
- The broad-based EAFE index of companies in developed foreign economies lost 3.01% in dollar terms.
- Emerging markets stocks of less developed countries, as represented by the EAFE EM index, gained 5.71%.
Other Investments
Looking over the other investment categories:
- Dow Jones Global World Real Estate index rose 4.76%.
- Commodities, as measured by the S&P GSCI index, lost 2.50%.
- The Barclays US Aggregate Bond index gained 3.03%.
- As of quarter end, 3-month Treasury notes were yielding 0.21%, 12-month Treasury bonds were yielding just 0.60%, and the 10-year Treasuries yield was 1.78%.
Market Analysis
The easy call at the beginning of the year would have been to bail out when the markets were declining and sit out the widely-predicted start of a painful, protracted bear market. Some analysts were talking openly about another 2008-2009 drop in share prices. But 10% market declines are a part of the market's normal turbulence, and anyone who spooks as soon as they see a month of bearish sentiment is likely to miss out on the subsequent gains. Since hitting their 2016 lows on February 11, both the S&P 500 index and the Nasdaq Composite have gained roughly 13% in value.
Granted, that doesn't guarantee that there will be gains going forward. The Market Watch website reports that half of the S&P 500 sectors are reporting declines in earnings per share this quarter over the same period last year, and a poll by the FactSet analysts suggests that seven out of the ten sectors will end the earnings season report declines.
Part of the wind at the backs of stocks this past six weeks has come, yet again, from the U.S. Federal Reserve Board, which had originally signaled that it planned to raise interest rates four times this year. After its most recent meeting, the Fed is projecting just two interest rate hikes this year, and Fed Chairwoman Janet Yellen has clearly indicated that the Fed will remain cautious about disrupting the markets or the economy as it unwinds its various QE initiatives.
Another tailwind was provided by the falling dollar. In the first three months of the year, the dollar's value against a basket of six major currencies fell 4.2%. A weaker dollar makes U.S. exports more price-competitive against goods and services sold in other currencies, potentially leading to higher top-line revenues for companies that do business overseas.
Investors also seemed to take comfort that the Chinese stock market has stabilized—for now, at least. Recently, Chinese officials reported the first rise in an important manufacturing statistic—the purchasing managers index—in eight months.
But arguably the biggest stabilizer of U.S. and global stock markets was the rise in oil—or, more precisely, the end of a long, unnerving drop in the price of crude that caused anxiety to ripple through the investor community. Analysts are not sure how the price of a barrel of crude oil is connected with the value of stocks; indeed, for most companies, lower energy costs are a net plus to the bottom line. But investors seemed to take comfort in the fact that the price of the world's most important commodity had stabilized. It's worth noting that the day the stock market hit its low for the year—February 11—was also the day when oil futures hit their low of $26.21 a barrel.
In the U.S., employment growth has remained strong, with 215,000 new jobs added in March, above predictions of 199,000. Overall, the economy has added millions of jobs in the last two years. Wage growth continues to be low—up 2.3% today over a year earlier—but while that's discouraging for workers, companies (and their bottom lines, and eventually their stock values) are benefiting from relatively cheap labor. It's worth noting that the Institute for Supply Management's manufacturing index reflected growth for the first time since last August, suggesting that manufacturing activity is picking up in the U.S. economy.
Does that mean the market will go up? We can't predict the future; indeed, even the present is hard to understand. Our mission as investors is to hang on and allow the millions of workers who get up every morning and go to work to do what they do best: to incrementally, hour by hour, day by day, week by week, grow the value of the companies we own with their efforts. Investors will spook and sometimes flee stocks, driving their prices down, but for the long-term, the returns on your investments are invisibly, inexorably driven by the underlying value that is created in the offices, cubicles, and factory floors all over the world.
As reflect on Q1 and the market volatility we experienced, we are once again reminded of the value of having a sound plan and sticking with it. Over the short run markets can and will move in unpredictable ways and short-term reactions rarely benefit the investor, Think and act long-term!
Sources:
Bob Veres, “CA – 2016-4-1 – Quarter-End Report”
Morningstar
Wilshire index data: http://www.wilshire.com/Indexes/calculator/
Russell index data: http://www.russell.com/indexes/data/daily_total_returns_us.asp
S&P index data: http://www.standardandpoors.com/indices/sp-500/en/us/?indexId=spusa-500-usduf--p-us-l--
Nasdaq index data: http://quicktake.morningstar.com/Index/IndexCharts.aspx?Symbol=COMP
International indices: http://www.mscibarra.com/products/indices/international_equity_indices/performance.html
Commodities index data: http://us.spindices.com/index-family/commodities/sp-gsci
Treasury market rates: http://www.bloomberg.com/markets/rates-bonds/government-bonds/us/
Aggregate corporate bond rates: https://indices.barcap.com/show?url=Benchmark_Indices/Aggregate/Bond_Indices
Aggregate corporate bond rates: http://www.bloomberg.com/markets/rates-bonds/corporate-bonds/
http://www.marketwatch.com/story/most-stocks-rose-during-the-first-quarter-surprised-2016-03-31
http://www.marketwatch.com/story/2016s-first-quarter-was-a-curious-case-of-mr-hyde-dr-jekyll-2016-03-31?siteid=rss&rss=1