![]()
Q3 2016 Quarter End Report
Submitted by Kaizen Financial Advisors, LLC on October 7th, 2016One hundred days after the Brexit scare, nine months after the most recent Fed rate hike, the markets once again confounded nervous investors by rising instead of falling. Last week, Fed Chairperson Janet Yellen told the world that the U.S. economy is healthy enough to weather a rise in interest rates, but the Fed governors met in September and declined to serve up the first rate hike since last December. That was reassuring news to the Wall Street traders, and investors generally, helping to provide yet another quarter of positive gains in U.S. stocks.
Let’s take a closer look. For those of you visually oriented, here’s a summary graph, followed by the specific details.
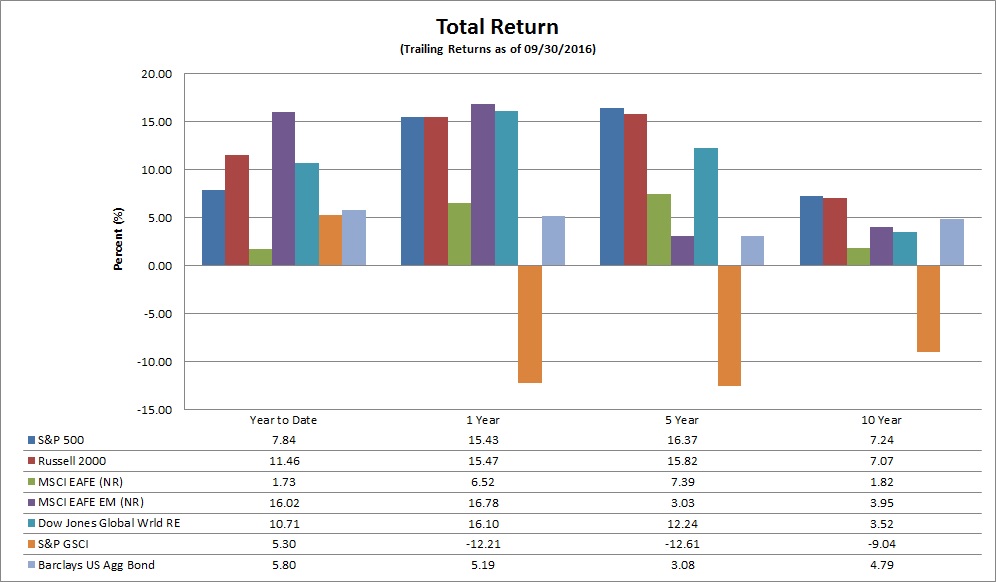
* Note that S&P 500, Russell 2000, Dow Jones Global World Real Estate, S&P GSCI, and Barclays US Aggregate Bond indices are reported in total return (TR), which includes all dividends reinvested, while MSCI EAFE and MSCI EAFE Emerging Markets are reported in price index (PR), which does not include dividends.
U.S. Index Performance
National markets, as measured by the S&P 500 and the Russell 2000 indices:
- The S&P 500 index posted a gain of 3.85% for the quarter and is up 7.84% year-to-date.
- The Russell 2000 Small-Cap index is up 9.05% for the quarter and up 11.46% year-to-date.
Global Returns
Meanwhile, in the global market:
- The broad-based EAFE index of companies in developed foreign economies gained 6.43% in dollar terms in this quarter, for a gain of 1.73% for the year so far.
- Emerging markets stocks of less developed countries, as represented by the EAFE EM index, gained 9.03% for the quarter and are up 16.02% for 2016.
Other Investments
Looking over the other investment categories:
- Dow Jones Global World Real Estate index rose 1.81% for the quarter, giving a total year-to-date gain of 10.71%.
- Commodities, as measured by the S&P GSCI index, lost 4.15% this quarter, but remain up 5.30% year-to-date.
- The Barclays US Aggregate Bond index is up 5.80% for the year. Three-month U.S. government notes yielded 0.27% at the end of the quarter, 12-month bonds paid just 0.58%, 10-year bonds are currently yielding 1.59%, and 30-year bonds gave a 2.32% annual coupon yield.
Market Analysis
What’s keeping stock prices high while sentiment appears to be—let’s call it “restrained”? Nobody knows for sure, but a deeper look at the U.S. economy suggests that the economic picture isn’t nearly as gloomy as some parties paint it:
Economic growth for the second quarter has been revised upwards from 1.1% to 1.4%, due to higher corporate spending in general and especially thanks to increased corporate investments in research and development.
America’s trade deficit shrank in August.
Consumer spending—which makes up more than two-thirds of U.S. economic activity—rose a robust 4.3% for the quarter, perhaps partly due to higher take-home wages this year.
Meanwhile, if someone had told you five years ago that today’s unemployment rate would be 4.9%, you would have thought they were highly optimistic. But after the economy gained 151,000 more jobs in August, unemployment remained below 5% for the third consecutive month, and continues trending downward. At the same time, average hourly earnings for American workers have risen 2.4% so far this year.
Based on their reading of the Treasury yield curve, economists at the Federal Reserve Bank of Cleveland have pegged the chances of a recession this time next year at a low 11.25%. They predict GDP growth of 1.5% for this election year—which, while below targets, is comfortably ahead of the negative numbers that would signal an economic downturn. (In general, a steep yield curve has been a predictor of strong economic growth, while an inverted curve where short-term rates are higher than longer-term yields are associated with a looming recession.)
On top of everything else, corporate profits have been on a long-term upswing, even if the rise has been choppy since 2008.
With everything looking so rosy domestically, some investors are wondering, “Why are we bothering with foreign stocks?” A recent Forbes column suggested the answer: Historically, since 1970, foreign stocks have outperformed domestic stocks almost exactly 50% of the time, meaning the long trend we’ve become accustomed to could reverse itself at any time.
Although economic statistics are weak “tea leaves” for trying to predict the market, the slow, steady growth we’ve experienced since 2008 shows no visible signs of ending. Additionally, we’re not seeing the usual euphoria and reckless investing that normally accompanies a market top and subsequent collapse of share prices. At the current pace, we might look back on 2016 as another pretty good year to be invested, which is really all we ask for.
Sources:
Wilshire index data. http://www.wilshire.com/Indexes/calculator/
Russell index data: http://indexcalculator.russell.com/
S&P index data: http://www.standardandpoors.com/indices/sp-500/en/us/?indexId=spusa-500-usduf--p-us-l--
Nasdaq index data: http://quicktake.morningstar.com/Index/IndexCharts.aspx?Symbol=COMP
International indices: http://www.mscibarra.com/products/indices/international_equity_indices/performance.html
Commodities index data: http://us.spindices.com/index-family/commodities/sp-gsci
Treasury market rates: http://www.bloomberg.com/markets/rates-bonds/government-bonds/us/
Aggregate corporate bond rates: https://indices.barcap.com/show?url=Benchmark_Indices/Aggregate/Bond_Indices
Aggregate corporate bond rates: http://www.bloomberg.com/markets/rates-bonds/corporate-bonds/
https://www.yahoo.com/news/yellen-defends-tougher-banking-regulations-141913276.html
http://www.bls.gov/news.release/pdf/empsit.pdf
https://www.yahoo.com/news/u-economy-less-sluggish-2nd-165152063.html
http://www.tradingeconomics.com/united-states/corporate-profits
https://www.clevelandfed.org/our-research/indicators-and-data/yield-curve-and-gdp-growth.aspx
http://www.forbes.com/sites/wadepfau/2016/09/29/us-markets-are-outperforming-global-markets-what-should-you-do/?utm_content=38955693&utm_medium=social&utm_source=twitter#476c0e8f3308