![]()
Quarterly Report for Q1, 2015
Submitted by Kaizen Financial Advisors, LLC on April 10th, 2015The first quarter of the 2015 has brought us small positive returns in many of the U.S. and global indices, and more than the usual amount of anxiety along with them. Let’s take a closer look:
U.S. Indices Performance
- The S&P 500 index of large company stocks posted a gain of 0.44% in the first quarter of the year.
- The Russell 2000 Small-Cap Index was up 4.32%.
- The technology-heavy Nasdaq Composite Index gained 3.48% for the quarter.
Global Returns
Meanwhile, global markets are showing signs of life, which means they’re giving returns comparable to the U.S. stock market.
- The broad-based EAFE index of companies in developed foreign economies gained 4.19% in dollar terms in the first quarter of the year, in part because Far Eastern stocks were up 8.27%. In aggregate, European stocks gained 5.15%, although they are still down more than 8% over the past 12 months.
- Emerging markets stocks of less developed countries, as represented by the EAFE EM index, fared less well, gaining 1.91% for the quarter.
Other Investments
Looking over the other investment categories:
- REIT index was up 4.67% for the first quarter.
- Commodities, as measured by the S&P GSCI index, continued their losing ways, dropping 8.22% of their value in the first quarter, largely because of continuing drops in oil prices.
Market Analysis
If you were watching the markets day to day, you experienced a mild roller coaster, what trading professionals refer to as a sideways market. One day it was up, the next down, each day (or week) seeming to erase the gains or losses of the previous ones. The best explanation for this phenomenon is that investors are still looking over their shoulders at interest rates, waiting for bond yields to jump higher, making bonds more competitive with stocks and triggering an outflow from the stock market that could (so the reasoning goes) cause a bear market in U.S. equities.
However, investors have been waiting for this shoe to drop for the better part of three years, and meanwhile, interest rates have drifted decidedly lower in the first quarter. The Bloomberg U.S. Corporate Bond Index now has an effective yield of 2.93%. As for Treasuries, 30-year Treasuries are yielding 2.48%, roughly 0.3% lower than in December, and 10-year Treasuries currently yield 1.87%, down from 2.17% at the beginning of the year
This interest rate watch has created a peculiar dynamic where up is down and down is up in terms of how traders and stock market gamblers look at the future. The generally positive economic news is greeted with dismay (The Fed will notice and start raising rates sooner rather than later! Boo!) and any bad news sends the stock market back up again into mild euphoria (The Fed might hold off another quarter! Yay!).
There are several obvious problems with this. First, probably least important, the Fed’s future actions are inscrutable. You will hear knowledgeable Fed-watchers say that the Fed will take action as early as June or as late as next year, and none of them really know.
Second, small incremental rises in interest rates are not closely associated with bear markets, as everybody seems to assume. Figure 1, below, is a little hard to interpret, but each blue square shows the price/earnings ratio for the U.S. stock market as a whole after interest rates have risen to particular levels, almost all of them higher than today.
Figure 1 Treasury Rates Associated with Russell 1000 PE Ratios
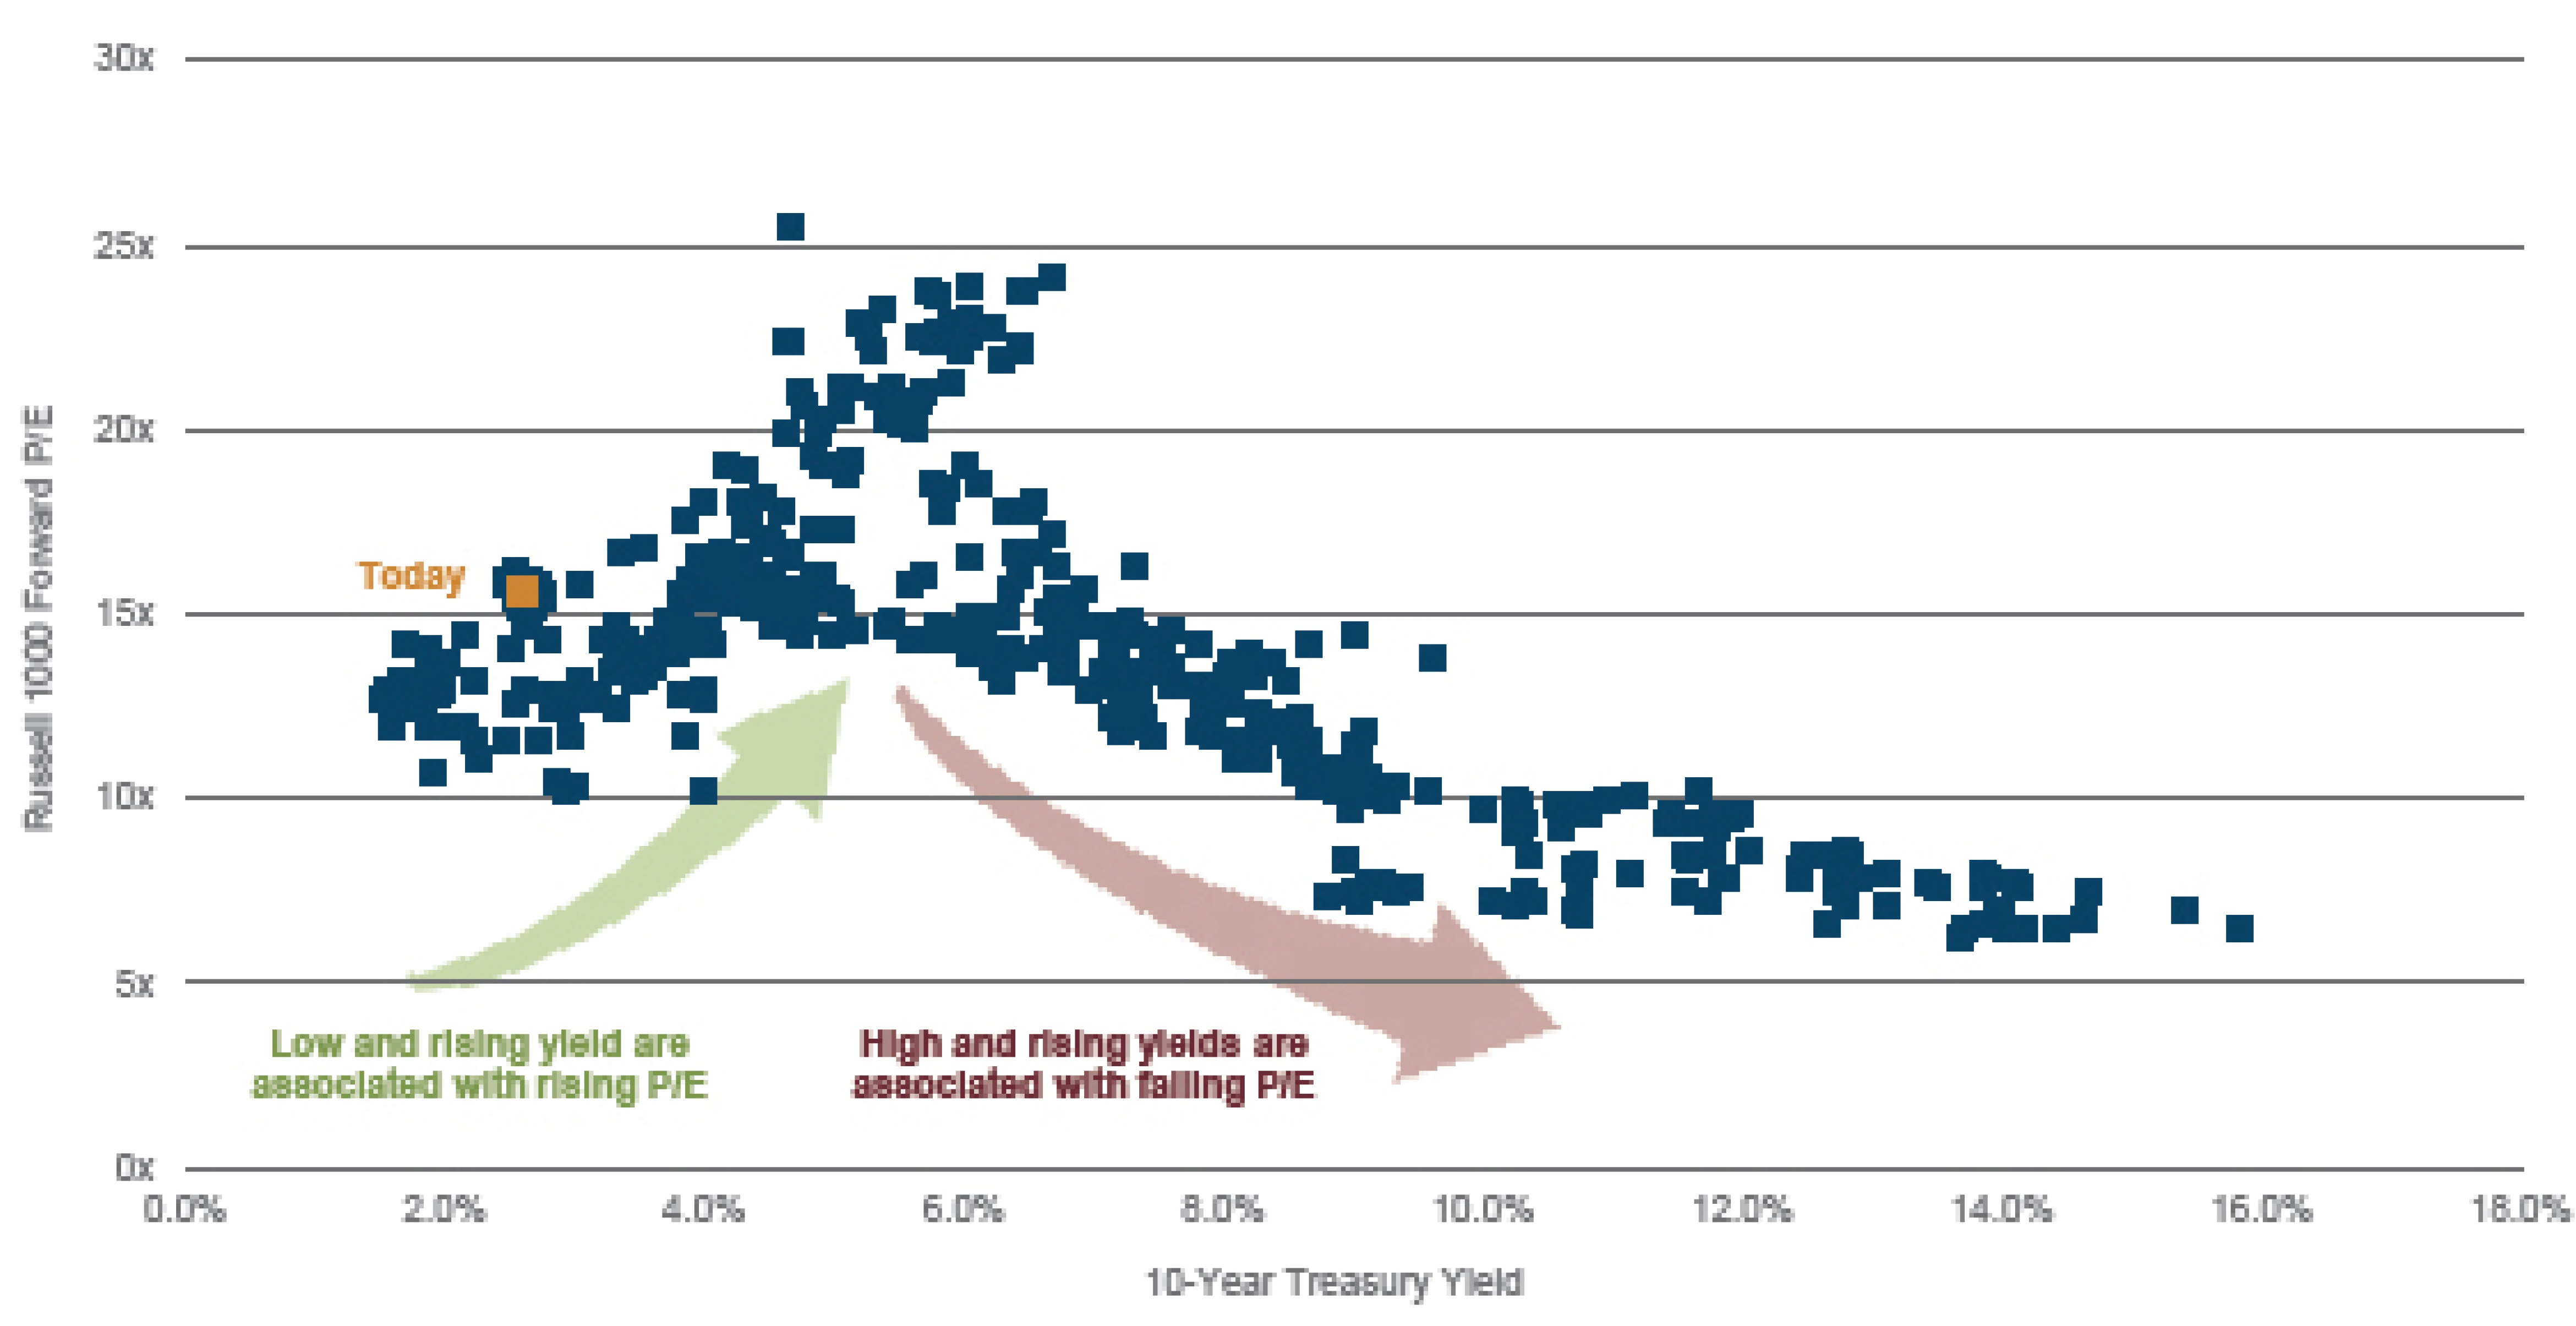
What you see is that when rates have gone up in the past, the price people will pay for stocks has also gone up. Why? For exactly the reason you think: rising rates are a sign of a healthy economy, which is precisely why the Federal Reserve Board would decide that stimulus is no longer necessary. Companies—and their stocks—tend to thrive in healthy economies.
The chart also shows that rates can get too high for the health of stocks—the cutoff point seems to be up around 5.5% to 6%. But incremental quarter-point rises are not going to take the U.S. economy into that territory for a long time.
Finally, we should all welcome the Fed pullback, not fear it. A lot of the uncertainty among traders and even long-term investors is coming from anxiety over how this experiment is going to end. The U.S. Central bank has directly intervened in the markets and in the economy, and is still doing so. When that ends, normal market forces will take over, and we’ll all have a better handle on what “normal” means in this economic era. Is there great demand for credit to fuel growth? What would rational investors pay for Treasury and corporate bonds if they weren’t bidding against an 800-pound gorilla? Would retirees prefer an absolutely certain 4.5% return on 30-year Treasury bonds or the less certain (but historically higher) returns they can get from the stock market? These are questions that all of us would like to know the answer to, and we won’t until all the QE interventions have ended.
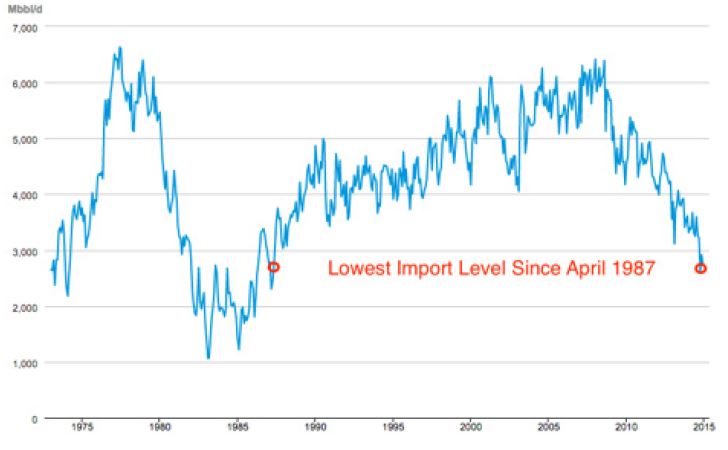
What DO we know? Figure 2, below shows that the U.S. economy is less dependent on foreign oil than at any time since 1987, and the trend is moving toward complete independence. Oil—and energy generally—is cheaper now than it has been in several decades, which makes our lives, and the production of goods and services, less expensive.
Figure 2 Number of Millions of Barrels of Oil Imported from OPEC since 1970
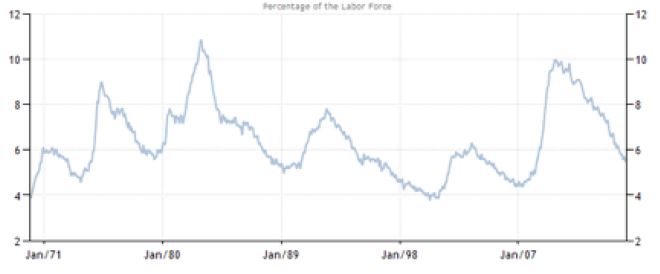
Meanwhile, more Americans are working. Figure 3, below, shows that the U.S. unemployment rate—at 5.5%—is trending dramatically lower, and is now reaching levels that are actually below the long-term norms. Unemployment today is lower than the rate for much of the booming ‘90s, and is approaching the lows of the early 1970s.
Figure 3 U.S. Unemployment Rate Since 1970
And real GDP—the broadest measure of economic activity in the United States—increased 2.4% last year, after rising 2.2% the previous year. America is growing. Not rapidly, but slow growth might not be so terrible. Rapid economic growth has, in the past, often preceded economic recessions, where excesses had to be corrected. Slow, steady growth may be boring, but it’s certainly not bad news for the economy or the markets.
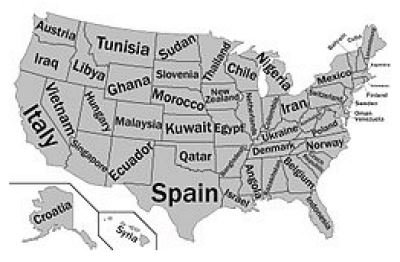
For fun, look at Figure 4, below, which shows the size of the U.S. economy compared with the rest of the world in a creative way. Each U.S. state is labeled with an entire country whose total economic output is roughly equal to that state’s. The point: The U.S. is still a colossus that stands across the global economy.
Figure 4 What Foreign Country Matches Each US State's Total GDP?
It has been said that people lose far more money in opportunity costs by trying to avoid future market downturns while the markets are still going up, than by holding their ground during actual downturns. And, in fact, in every case so far, the U.S. market has eventually made up the ground it lost in every bear market we’ve experienced. The last trading day of the quarter looked bearish, as have many other gloomy trading days during this seven year bull market. It seems like every week, somebody else has predicted an imminent decline that has not happened. People who listened to the alarmists lost out on solid returns. You filter out the good news at your peril.
Sources:
Wilshire index data: http://www.wilshire.com/Indexes/calculator/
Russell index data: http://www.russell.com/indexes/data/daily_total_returns_us.asp
S&P index data: http://www.standardandpoors.com/indices/sp-500/en/us/?indexId=spusa-500-usduf--p-us-l--
http://www.tradingeconomics.com/united-states/unemployment-rate
Nasdaq index data: http://quicktake.morningstar.com/Index/IndexCharts.aspx?Symbol=COMP
International indices: http://www.mscibarra.com/products/indices/international_equity_indices/performance.html
Commodities index data: http://us.spindices.com/index-family/commodities/sp-gsci
Treasury market rates: http://www.bloomberg.com/markets/rates-bonds/government-bonds/us/
http://www.bloomberg.com/news/articles/2015-04-01/u-s-oil-imports-from-opec-have-plunged-to-a-28-year-low
Aggregate corporate bond rates: https://indices.barcap.com/show?url=Benchmark_Indices/Aggregate/Bond_Indices
Aggregate corporate bond rates: http://www.bloomberg.com/markets/rates-bonds/corporate-bonds/
http://bea.gov/newsreleases/national/gdp/gdpnewsrelease.htm