![]()
Year End Update
Submitted by Kaizen Financial Advisors, LLC on January 13th, 20172016 was another interesting year in the markets because who would have imagined record market highs at this point last year, when the indices ended the year in negative territory? Or when 2016 got off to such a rocky start, tumbling 10% in the first two weeks—the worst start to a year since 1930? The markets eventually bottomed in mid-February and began a long, slow recovery, turning positive by the end of March, suffering a setback when the U.K. decided to leave the Eurozone and endured another hard bump right after the elections. In the end, the Dow finished at 19,762 for the year another year for the bull market.
Let’s take a closer look. For those of you visually oriented, here’s a summary graph, followed by the specific details.
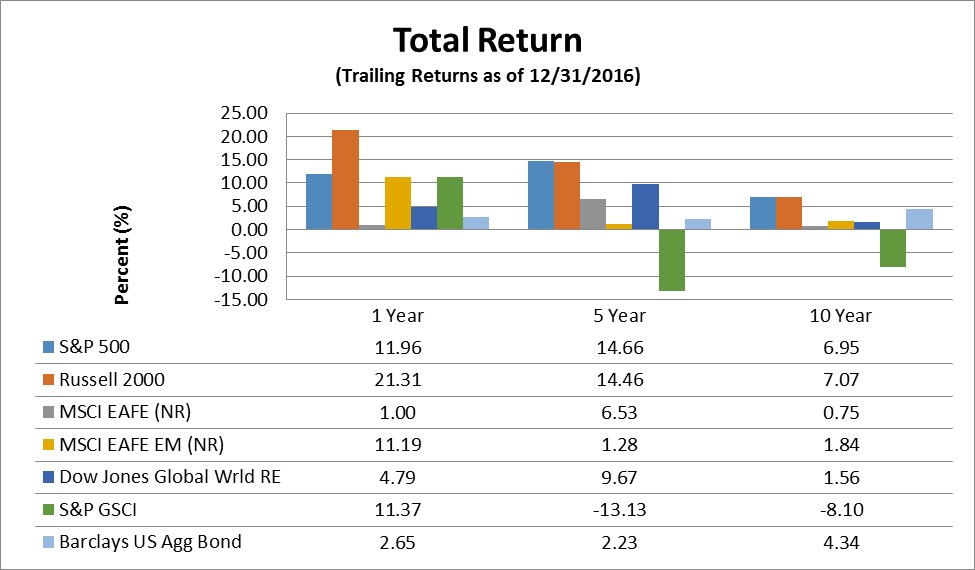
* Note that S&P 500, Russell 2000, Dow Jones Global World Real Estate, S&P GSCI, and Barclays US Aggregate Bond indices are reported in total return (TR), which includes all dividends reinvested, while MSCI EAFE and MSCI EAFE Emerging Markets are reported in price index (PR), which does not include dividends.
U.S. Index Performance
National markets, as measured by the S&P 500 and the Russell 2000 indices:
The S&P 500 index posted a gain 3.82% in the fourth quarter and was up a healthy 11.96% for the year.
The Russell 2000 Small-Cap index was up 8.83% in the fourth quarter and up 21.31% for the year.
Global Returns
Meanwhile, in the global market:
The broad-based EAFE index of companies in developed foreign economies lost 0.71% in dollar terms last quarter, but shows a gain of 1% for 2016.
Emerging markets stocks of less developed countries, as represented by the EAFE EM index, lost 4.16% for the quarter but remained up 11.19% for the year.
Other Investments
Looking over the other investment categories:
Dow Jones Global World Real Estate index fell 5.35% for the quarter, but a total year gain of 4.79%.
Commodities, as measured by the S&P GSCI index, gained 5.76% this quarter, and produced a gain of 11.37% for the year.
The Barclays US Aggregate Bond index is down 2.98% for the year. Meanwhile, 30-year Treasuries were yielding 3.06% at year end, up from 3.02% nearly unchanged from year end last year, and 10-year Treasuries currently yield 2.45%, up from 2.30% at this time last year.
The Year Ahead
What’s going to happen in 2017? Of course we don’t have a crystal ball, but short-term market traders seem to be anticipating a robust economic stimulus combined with lower taxes and deregulatory policies that would boost the short-term profits of American corporations. At the same time we are entering the ninth year of economic expansion, making this the fourth longest since 1900, and making some pundits wonder if the upward trend can continue.
Over the past 7 years, slow and steady has not been a terrible formula for workers or stock investors. The unemployment rate has slowly ticked down from a post-recession peak of 10% to less than 5% currently. U.S. stock indices are posting record highs with double-digit gains, and that Dow 20,000 level, while essentially meaningless, is still catching a lot of attention.
Even with the good economic news, uncertainty still abounds. It’s clear that the new President-elect wants to accelerate America’s economic growth, but the policy prescription has not been clear. At the same time, there are many unknowns around the globe. China’s economic growth has stalled for the second consecutive year, Italy faces a potential banking crisis, and allegations of Russian hacking has created questions regarding the security of our Internet infrastructure.
Every year of this longstanding bull market, we have to look over our shoulders and wonder when and how it will end. However, what we have learned over the past few years is that the markets have a way of surprising us, and that trying to time the market, and get out in anticipation of a downturn, is a loser’s game. The history of the markets has been a general upward trend that benefits long-term investors, and looking out over the long-term, that—and a few hard bumps along the way--is probably the best outcome to expect.
Sources:
Wilshire index data: http://www.wilshire.com/Indexes/calculator/
Russell index data: http://www.russell.com/indexes/data/daily_total_returns_us.asp
S&P index data: http://www.standardandpoors.com/indices/sp-500/en/us/?indexId=spusa-500-usduf--p-us-l--
Nasdaq index data:
http://quotes.morningstar.com/indexquote/quote.html?t=COMP
http://www.nasdaq.com/markets/indices/nasdaq-total-returns.aspx
International indices: https://www.msci.com/end-of-day-data-search
Commodities index data: http://us.spindices.com/index-family/commodities/sp-gsci
Treasury market rates: http://www.bloomberg.com/markets/rates-bonds/government-bonds/us/
Aggregate corporate bond rates:
https://index.barcap.com/Benchmark_Indices/Aggregate/Bond_Indices
Aggregate corporate bond rates: http://www.bloomberg.com/markets/rates-bonds/corporate-bonds/
Muni rates: https://indices.barcap.com/show?url=Benchmark_Indices/Aggregate/Bond_Indices
http://www.wsj.com/articles/chinas-stock-market-still-a-draw-after-tumultuous-year-1451303164
http://www.marketwatch.com/story/these-are-the-bestand-worstperforming-assets-of-2016-2016-12-30?link=sfmw_tw
http://www.theworldin.com/article/10632/unsettling-year-markets
http://www.forbes.com/sites/maggiemcgrath/2016/12/30/markets-end-last-trading-day-of-2016-in-red-but-post-gains-for-the-year/#7db846fd7c07